
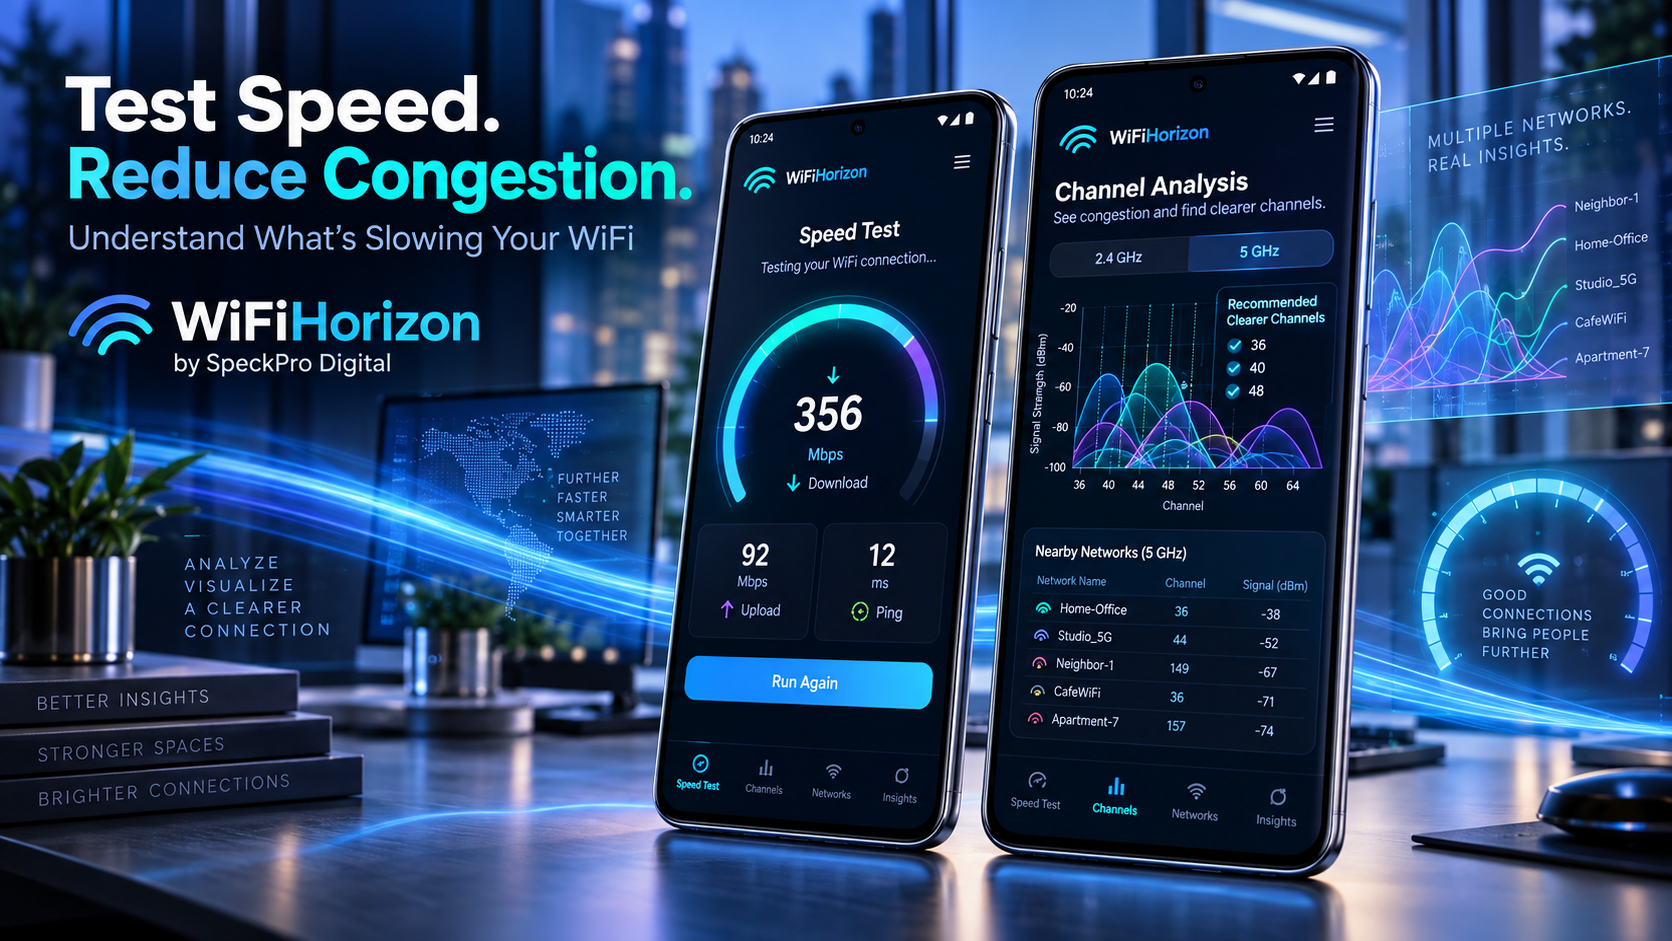
A WiFi dead zone can turn an otherwise reliable internet connection into a frustrating experience. Video calls freeze, pages load slowly, and streaming quality drops in specific rooms or areas. WiFiHorizon: AI WiFi Analyzer helps users identify these weak spots, understand what is affecting their network, and improve router placement using live signal data, Walk Mode, WiFi heatmaps, channel analysis, and AI-powered guidance.
What Is a WiFi Dead Zone?
A WiFi dead zone is an area where the wireless signal becomes too weak or unstable for reliable use. The connection may disappear completely, or it may remain visible while video calls freeze, pages load slowly, and streaming quality drops. Dead zones often appear in upstairs rooms, basements, garages, outdoor areas, or spaces separated from the router by dense walls and large objects.
WiFiHorizon: AI WiFi Analyzer helps users investigate these weak areas with live signal monitoring, Walk Mode, and visual WiFi heatmaps. Instead of judging coverage from a single speed test, users can compare readings across a room, an entire floor, or multiple locations and see how the network changes throughout the space.
Why Router Placement Changes WiFi Coverage
A router sends radio signals in multiple directions, but the surrounding environment shapes how far and how reliably those signals travel. Cabinets, concrete walls, metal surfaces, mirrors, appliances, and floor structures can weaken or reflect WiFi. A router placed at one edge of a property may also waste coverage outside while leaving distant rooms underserved.
A more central, elevated, and open position often provides better results than hiding the router on the floor or inside furniture. However, every property is different. WiFiHorizon allows users to measure the effect of placement changes instead of relying entirely on general advice.
Use Live dBm Readings as a Coverage Baseline
Begin near the router and record the live signal-strength reading in dBm, along with the percentage and quality label shown by WiFiHorizon. Walk toward the problem area at a steady pace and watch the real-time graph. A gradual decline is expected as distance and obstacles increase, but a sharp drop can reveal a specific wall, doorway, or structure that affects coverage.
Repeat the test from more than one direction when possible. Also note the frequency band because different bands can behave differently through walls and over distance. The goal is not to chase one perfect number. It is to compare locations consistently and identify where everyday activities stop working well.
Map Weak Areas with Walk Mode
Walk Mode is designed for practical room-by-room testing. Users can move through a home or office while observing changes in signal quality. This is especially helpful when the network works near a doorway but weakens beside a desk, bed, television, or another frequently used position.
Test the places where connectivity actually matters, such as a remote-work desk, gaming setup, smart TV, study area, or security camera location. Coverage should be evaluated around the activity, not only in the center of the room. Running the same route after moving the router provides a direct before-and-after comparison.
Create a Visual WiFi Heatmap
A WiFi heatmap converts measurements into a visual representation of stronger and weaker coverage. WiFiHorizon can create heatmaps for rooms and floors, making patterns easier to recognize than a list of readings. The visual can reveal whether one corner is consistently weak, whether a central obstacle divides the coverage area, or whether an entire floor needs attention.
For useful comparisons, keep the testing method consistent. Use the same phone, hold it similarly, follow the same route, and avoid changing several router settings at once. Environmental conditions and device behavior can affect results, so repeated measurements provide a more dependable picture than a single pass.
Improve WiFi Coverage Step by Step
Start with a small router-placement adjustment, then repeat the signal walk and heatmap. If the router has external antennas, follow the manufacturer’s guidance. Keep the unit ventilated and away from large metal objects or equipment that may contribute to interference. Review nearby networks and channel congestion in WiFiHorizon before changing channel settings.
If placement improvements are not enough, the property may require additional equipment, such as a properly positioned access point or mesh system. A heatmap can help identify where added coverage is needed and can also be used to evaluate the result after installation. Users should choose equipment that matches their router, layout, and performance requirements.
Ask the AI WiFi Assistant to Explain the Results
WiFiHorizon’s AI WiFi Assistant can help interpret weak readings, possible dead-zone causes, congestion, and router-placement choices. A useful question includes the room, approximate distance from the router, important obstacles, signal readings, and speed-test results. Better context allows the assistant to offer more relevant guidance.
New users receive up to five free AI chats, after which a subscription is required to continue. Together, the live graph, Walk Mode, heatmaps, channel analysis, and AI guidance provide a structured way to understand WiFi coverage and make improvements based on evidence rather than guesswork.
Download WiFiHorizon
WiFiHorizon is available for Android through Google Play. Download the app to analyze signal strength, test performance, explore coverage, review nearby networks, inspect connected devices, and receive practical AI-powered WiFi guidance.
Download WiFiHorizon on Google Play: https://play.google.com/store/apps/details?id=com.wifi.optimizer.internet.app.analyzer.tool.android.odl
About SpeckPro Digital
WiFiHorizon: AI WiFi Analyzer is designed, developed, and published by SpeckPro Digital. SpeckPro Digital creates practical digital products that make technology easier to understand and use.
SpeckPro Digital website: https://speckpro.com/
SpeckPro Digital on Google Play: https://play.google.com/store/apps/dev?id=7164438282630310277